
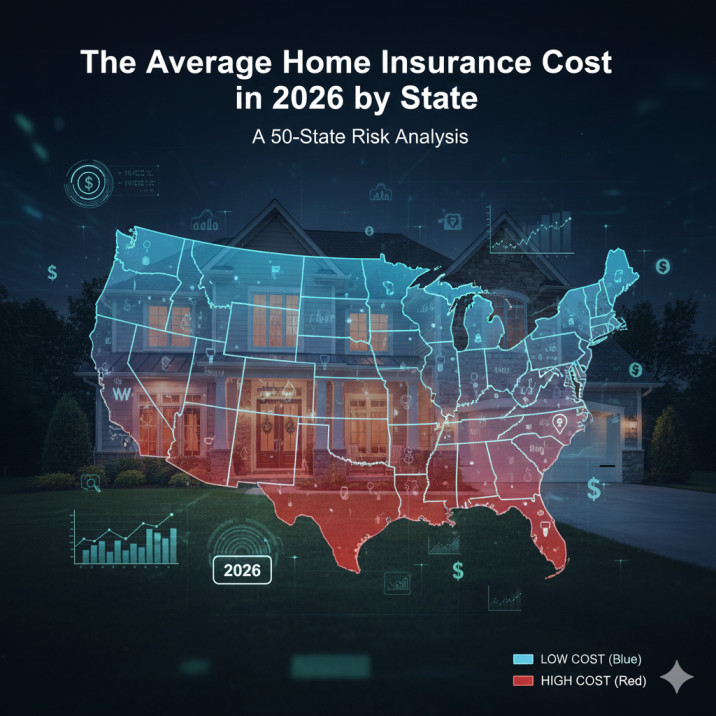
The most important thing to know about home insurance costs in 2026 is that the national average is nearly useless as a planning number. Not because the data is wrong — the methodologies behind the major analyses are rigorous — but because the variance between states is so large that averaging across them produces a figure that doesn’t describe anyone’s actual situation. The gap between the most and least expensive states has reached $9,639 per year for a $300,000 dwelling policy according to MoneyGeek’s June 2026 50-state analysis — Florida homeowners pay $10,240 per year on average while Hawaii homeowners pay $601, a 17-to-1 ratio for comparable homes. When a single variable — your state of residence — can swing your annual insurance cost by over $9,000, the national average tells you almost nothing about what to expect.
What the state-by-state analysis does tell you is something considerably more useful: it maps the geography of risk in America, and understanding that map helps homeowners interpret their own premiums, anticipate future increases, and make housing decisions with clearer financial visibility. The 50-state picture that emerges from 2026 data is one of accelerating divergence — the expensive states are getting more expensive faster, the affordable states are holding, and the gap between them is wider than at any point in the modern history of homeowners insurance.
The National Baseline and Why It’s Moving
Before looking at individual states, understanding the trajectory that’s driving the baseline matters. The national average homeowners insurance premium in 2026 is $2,543 per year, or $212 per month, for a policy with $300,000 in dwelling coverage and a $1,000 deductible — based on Insurance.com’s comprehensive March 2026 rate analysis covering 134 insurance companies across 10,042 counties and 34,595 ZIP codes using 37.9 million insurance quotes. That figure from a single consistent methodology is the most reliable national benchmark available, though different analytical approaches produce numbers ranging from $2,100 to $3,548 depending on the coverage profile used.
What matters more than the current number is the trend. The national average homeowners insurance premium has risen 23% in three years, driven by severe weather frequency and severity, soaring rebuild costs reflecting construction labour and materials inflation, rising reinsurance prices globally, and insurer market exits in the highest-risk states that reduce competition and push remaining carriers to price for concentrated risk. The premium trend data sourced from the Insurance Information Institute, the National Association of Insurance Commissioners, and S&P Global Market Intelligence all point in the same direction: the structural drivers of premium increases are not temporary inflation effects. They reflect a fundamental repricing of climate risk that is projected to continue for at least a decade.
The National Oceanic and Atmospheric Administration reported that 2024 recorded 27 billion-dollar weather and climate disasters in the United States — a figure that directly explains insurer loss experience and the underwriting model recalibration driving premium increases. When NOAA documents nearly three dozen major weather events that each cause over a billion dollars in damage in a single year, the insurance market is pricing those events into future premiums. The states most exposed to those events are experiencing the largest premium increases.
The Most Expensive States and Why They Got There
The ten most expensive states for home insurance cluster in two distinct geographies: the Gulf Coast and South Atlantic (Florida, Louisiana, Mississippi, Alabama, Texas) and the Great Plains and Southern Plains (Oklahoma, Kansas, Nebraska, Arkansas). Understanding what drives each cluster explains why the premiums are what they are and whether they’re likely to moderate.
Florida occupies a category of its own. Florida homeowners pay $7,136 per year on average for a $300,000 dwelling policy — 181% above the national average according to Insurance.com’s March 2026 analysis — with hurricanes and extraordinary litigation frequency as the primary drivers. The litigation factor is worth understanding separately from the weather risk. Florida’s legal environment around insurance claims, including attorney involvement rates and the legacy of assignment-of-benefits abuse, added a significant non-weather cost component that the state legislature attempted to address through tort reform enacted in 2022 and 2023. The reforms are beginning to show effects in claims frequency data, but the premium impact is lagging — the market is still pricing the risk environment that preceded the reforms.
Louisiana carries the second-highest exposure after Florida, driven by hurricane vulnerability and the memory of Katrina, Ida, and the accelerating pace of named storms making landfall. Oklahoma leads the inland states at rates that rival or exceed coastal states in some analyses, because severe convective storms — tornadoes and hail specifically — cause concentrated losses in a relatively small insured population. An Oklahoma homeowner with a comparable property to an Oregon homeowner pays $640 per month for coverage versus $90 per month in Oregon, a difference of $6,600 annually that reflects the difference between Tornado Alley exposure and Pacific Northwest risk geography.
Nebraska and Kansas follow Oklahoma in the Plains cluster. Nebraska’s average homeowners insurance rates declined 5% from 2025 to 2026 — a rare bright spot driven by fewer major hail events in the preceding period and moderate rate concessions from insurers competing to retain market share. The Nebraska decline is the exception. Kansas, Arkansas, Colorado, and Texas have all seen continued increases driven by hail severity, wildfire encroachment in the case of Colorado, and rebuild cost escalation.
The Most Affordable States and What Protects Them
At the other end of the spectrum, the most affordable states share a combination of geographic factors that meaningfully reduce the catastrophic loss scenarios insurers are pricing against. Hawaii at $601 to $659 per year ($300,000 dwelling policy) remains the most affordable state for homeowners insurance, despite its island location — a counterintuitive result explained by the absence of tornadoes and hail risk, limited wildfire exposure in most communities, and a construction environment and litigation culture that produces lower claims costs than mainland high-risk states. Hawaii requires a separate hurricane policy because standard policies exclude hurricane damage there — that exclusion needs to be understood before concluding Hawaii is straightforwardly cheap.
Vermont is the most affordable mainland state at $1,000 to $1,170 per year, reflecting minimal exposure to the catastrophic weather categories that drive the most expensive markets. Delaware and Oregon follow, with Delaware benefiting from mid-Atlantic climate stability and Oregon from the combination of low hail risk, moderate wildfire exposure relative to California, and a population distribution that limits concentrated losses.
The affordable states are not uniformly without risk. Oregon and Washington face growing wildfire exposure and a long-deferred earthquake risk whose actuarial implications are not yet fully reflected in standard homeowners insurance pricing — though earthquake is a separate policy in both states. Vermont and other Northeast states carry flood risk that the standard HO policy doesn’t cover, requiring separate coverage through the Federal Emergency Management Agency’s National Flood Insurance Program, which provides flood coverage for homeowners in flood-prone areas that standard homeowners policies explicitly exclude, with average NFIP policy costs running $700 to $1,000 annually. The FEMA NFIP cost is an additional expense that homeowners in low-premium states sometimes overlook when comparing total insurance costs across states.
What 2026’s Rate Slowdown Means for Homeowners
Homeowners may be seeing a slower pace of insurance-price increases in some markets in 2026, but that does not mean premiums are falling everywhere. Home insurance remains highly dependent on location, property characteristics, claims history, construction costs, catastrophe exposure, insurer availability, and the coverage selected.
Current industry estimates also differ because analysts use different policy limits, deductibles, homeowner profiles, geographic data, and methodologies. For example, Insurify currently projects the national average annual cost of homeowners insurance at about $3,057 by the end of 2026, representing a 4% increase, while other published estimates can be materially different. (Insurify)
Why published home-insurance averages can look so different
There is no single “average” homeowners-insurance policy.
An estimate based on a particular dwelling value, liability limit, deductible, homeowner profile, or set of states can produce a very different figure from another study. That means homeowners should treat national averages as benchmarks rather than quotes.
For example, a national estimate should not be interpreted as meaning that every homeowner will pay approximately that amount. Your actual premium can be substantially higher or lower depending on your property and location.
When comparing published rates, check:
- the dwelling coverage limit;
- the deductible;
- whether replacement-cost or actual-cash-value coverage is assumed;
- the location and risk profile;
- the policyholder characteristics used in the analysis; and
- the date the data was collected.
This distinction is especially important when comparing 2026 estimates from different insurance publications.
Why some homeowners are still facing sharp increases
A national slowdown does not eliminate local insurance pressure.
Insurers continue to account for catastrophe losses, rebuilding costs, inflation, reinsurance expenses, property-specific risks, and the availability of coverage in individual markets. In some high-risk areas, homeowners can therefore experience much larger increases than a national average suggests. Insurify’s current 2026 outlook, for example, identifies California, Nebraska, New Mexico, and Georgia among states that could see increases of 10% or more. (Insurify)
Technology is also changing how insurers evaluate properties. Insurers are increasingly using aerial imagery, satellite photographs, drones, and artificial intelligence to identify issues such as aging roofs, debris, vegetation, and other property risks. (Insurify)
For homeowners, that means maintaining the property and documenting improvements can become increasingly important during underwriting and renewal.
What if you can no longer afford your homeowners insurance?
If your premium becomes unaffordable, simply cancelling coverage can create a much larger financial problem—particularly if your mortgage lender requires insurance.
Start by contacting your insurer or an independent insurance agent and asking whether there are:
- alternative deductible options;
- available discounts;
- bundling opportunities;
- mitigation credits;
- coverage changes that could reduce the premium without leaving major risks uninsured; or
- other insurers willing to quote the property.
Homeowners in high-risk markets may also encounter state-supported insurance mechanisms when private-market coverage becomes difficult to obtain. FAIR plans, for example, exist in numerous states, although their eligibility requirements, coverage and pricing vary by state. The National Association of Insurance Commissioners notes that these alternative markets can involve trade-offs such as higher deductibles or narrower coverage. (NAIC Content)
The key point is that a cheaper policy is not automatically a better policy. Compare the coverage, exclusions, deductibles and limits—not just the annual premium.
Ways to reduce your premium without simply reducing protection
Homeowners who want to control costs should consider several options before cutting essential coverage.
Shop around. Obtain quotes from multiple insurers or work with an independent agent who can compare available carriers.
Review your deductible. A higher deductible can reduce the premium, but only choose a deductible you could realistically afford after a covered loss.
Ask about mitigation discounts. Improvements that reduce property risk may qualify for discounts with some insurers. Availability varies by insurer and state.
Maintain the roof and major systems. Roof condition, electrical systems, plumbing, heating and cooling equipment can influence underwriting and eligibility.
Consider bundling. Some insurers offer discounts when multiple policies are placed with the same company.
Review your coverage annually. Make sure your dwelling limit, personal-property coverage and other limits still reflect your circumstances. Avoid reducing important coverage solely to achieve a lower premium.
The bigger picture for 2026
The most useful way to think about the 2026 homeowners-insurance market is not simply “rates are going up” or “rates are slowing.”
The more accurate picture is that the market is becoming increasingly risk-sensitive and location-specific.
A homeowner in a relatively low-risk market may experience a very different renewal outcome from a homeowner facing wildfire, hurricane, severe-weather, flood or other catastrophe exposure. At the same time, insurers are using more data and technology to evaluate individual properties.
That makes the national average useful for context—but your property’s risk profile, local insurance market and actual policy terms matter more when estimating what you will pay.
Important: Home-insurance premiums, coverage requirements, discounts and availability vary by insurer and state. Published averages are estimates and should not be treated as personalized insurance quotes or guarantees of future rates.
What Drives Your Premium Beyond Geography
The state average is the anchor, but individual premiums vary significantly around it based on factors that homeowners can influence to varying degrees.
Your home’s age and construction are significant variables. Homes with older roofs — particularly those over fifteen years old — face substantial rating penalties in high-risk states; replacing a roof before renewal is one of the highest-ROI insurance-related home improvements available to homeowners in tornado and hurricane zones. Modern construction materials and methods — impact-resistant roofing, reinforced garage doors, hurricane straps — generate discount eligibility that partially offsets the premium pressure in high-risk states.
Your credit score, where state law permits its use in insurance rating, carries meaningful premium weight. The National Association of Insurance Commissioners confirms that credit-based insurance scores are used by most carriers in most states as a rating factor, with the actuarial relationship between credit profile and claims frequency well-documented in insurer loss data. California, Maryland, and Massachusetts prohibit credit use in insurance rating; most other states allow it. A homeowner in Oklahoma with excellent credit may pay meaningfully less than the state average. A homeowner with poor credit may pay significantly more.
The claim history factor compounds over time in ways that most homeowners don’t fully account for. Filing two or more claims within five years, even for legitimate covered losses, typically produces significant premium increases or non-renewal notices in high-loss states where insurers are managing their aggregate exposure. The practical implication is that homeowners in high-premium states should evaluate smaller claims carefully against their deductible and the potential five-year cost of the claims flag, rather than assuming every covered loss should automatically become a claim.
The AI underwriting dimension is increasingly relevant here. As our analysis of how AI underwriting algorithms are setting insurance premiums documents, the variables feeding into individual premium calculations now extend well beyond the traditional rating factors — satellite imagery of your roof, aerial property assessments, and external data sources that you may not know are being incorporated. And the fairness implications of those models, including whether ZIP code-based pricing produces racially disparate outcomes in communities shaped by historical housing patterns, are examined in our piece on AI bias in insurance and whether algorithms discriminate against consumers.
The broader consumer insurance landscape — including what renters insurance covers, what it doesn’t, and the myths most costly when tested against reality — is explored in our guide to renters insurance myths and what coverage actually does.
Frequently Asked Questions
What is the average cost of homeowners insurance in 2026?
The national average homeowners insurance cost in 2026 is $2,543 per year, or approximately $212 per month, for a policy providing $300,000 in dwelling coverage with $300,000 in liability coverage and a $1,000 deductible — based on Insurance.com’s March 2026 comprehensive rate analysis using 37.9 million insurance quotes from 134 companies across all 50 states. This average is based on a specific coverage profile and methodology; analyses using higher dwelling coverage limits (such as NerdWallet’s $400,000 dwelling coverage analysis) produce slightly different national averages in the $2,490 range. The national average has risen 23% over three years, driven by severe weather frequency, construction cost inflation, global reinsurance price increases, and insurer market exits in high-risk states. The national average is most useful as a benchmark for comparison with state-specific and local rates, not as a predictor of any individual homeowner’s premium.
Which state has the highest home insurance rates in 2026?
Florida has the highest homeowners insurance rates in 2026 regardless of which major analysis you consult. Insurance.com’s comprehensive March 2026 analysis places Florida’s average at $7,136 per year for a $300,000 dwelling policy — 181% above the national average. MoneyGeek’s analysis using a slightly different coverage profile places the figure at $10,240 per year. Both analyses confirm Florida leads the nation by a substantial margin, with Louisiana as the second most expensive state. Florida’s elevated rates reflect a combination of hurricane frequency and severity, litigation environment (though improving following 2022–2023 tort reforms), assignment-of-benefits claims practices, global reinsurance cost increases that disproportionately affect high-frequency markets, and the insolvency of multiple domestic Florida-focused insurers between 2020 and 2024 that reduced market competition. Oklahoma and Nebraska rank among the most expensive inland states due to tornado, hail, and severe convective storm exposure.
Which states have the cheapest homeowners insurance in 2026?
Hawaii consistently ranks as the cheapest state for homeowners insurance in 2026, at $601 to $659 per year for a $300,000 dwelling policy across major analyses — 83% below the national average. This low rate reflects Hawaii’s absence of tornado and hail risk, limited wildfire exposure in most communities, and a favourable litigation environment. However, standard homeowners insurance in Hawaii excludes hurricane coverage, which requires a separate policy and should be factored into the total cost of coverage. Vermont is the most affordable mainland state at $1,000 to $1,170 per year, followed by Delaware and Oregon. States with consistently affordable rates share low exposure to the catastrophic weather categories — hurricanes, tornadoes, hail — that drive the most expensive markets. Homeowners in these states should still evaluate whether separate flood coverage through FEMA’s National Flood Insurance Program and earthquake coverage (where relevant) are appropriate for their specific location.
Why are home insurance rates rising so much in 2026?
Home insurance rates are rising due to a convergence of structural factors that are not temporary. First, NOAA reported 27 billion-dollar weather and climate disasters in the United States in 2024 alone — the frequency and severity of catastrophic weather events is increasing, driving higher insurance claims across the industry. Second, construction costs for labour and materials have elevated rebuild costs significantly, meaning the same structure costs more to repair or replace than it did three years ago. Third, global reinsurance prices have risen sharply as international insurers respond to increasing worldwide climate losses, and these increases are passed through to primary policyholders. Fourth, major insurers have exited high-risk markets — including Allstate and State Farm reducing their California homeowners exposure — concentrating risk among remaining carriers and reducing competition that would otherwise moderate prices. The national average has risen 23% in three years, with high-risk states experiencing increases of 50% to over 100% in the same period.
How can I lower my home insurance premium regardless of what state I’m in?
The most consistently effective premium reduction strategies across all states include: shopping across multiple insurers annually rather than allowing auto-renewal, because rates diverge significantly between carriers for the same risk profile; bundling home and auto insurance with the same carrier for discounts that typically reduce both premiums by 10 to 25%; increasing your deductible from $1,000 to $2,500 or $5,000, which can reduce premiums 10 to 20% while limiting your insurance use to larger losses where the coverage has the most financial impact; upgrading your roof with impact-resistant materials that qualify for premium credits in tornado and hail states; maintaining or improving your credit score, which the National Association of Insurance Commissioners confirms is a permitted rating factor in most states with documented actuarial correlation to claims frequency; and asking specifically about all available discounts including security systems, smoke detectors, sprinkler systems, and new construction credits. In high-risk states specifically, hardening your home against the primary local hazard — hurricane shutters in Florida, hail-resistant roofing in Oklahoma — generates discount eligibility from most carriers writing that market.
The Bottom Line
The 50-state premium map tells a story about American geography and risk that is more financially consequential than most housing decisions account for. For a homeowner considering a move, insurance cost is a real monthly carrying expense that can vary by $400 to $500 per month between the most and least expensive states for an identical home — a difference that can swing affordability more than a 50-basis-point mortgage rate change. A home buyer moving from Vermont to Oklahoma is taking on $500+ in additional monthly insurance expense before they’ve evaluated a single policy — an expense that compounds over the life of the mortgage into a sum that rivals the interest cost itself.
The premium trajectory makes this more urgent, not less. The 23% three-year increase in national averages reflects structural forces — climate volatility, reinsurance costs, rebuild cost inflation — that are not self-correcting on short timelines. The states that are expensive now are likely to be more expensive in three years. The states that are affordable now are the ones without exposure to the catastrophic weather patterns whose frequency is increasing under observed climate trends.
The individual levers — credit management, deductible choices, home hardening, annual shopping — matter within any market. But the most significant driver of your homeowners insurance premium is where you choose to live, and in 2026, that fact carries more financial weight than at any point in the modern history of the product.
This article is for informational purposes only and does not constitute insurance, financial, or legal advice. Premium data reflects averages from large-scale analyses using standardised coverage profiles and may differ from individual quotes. Always consult a licensed insurance professional for advice specific to your property and circumstances.






Thanks for these guidelines. One thing I also believe is credit cards featuring a 0 monthly interest often entice consumers with zero rate, instant acceptance and easy on the web balance transfers, however beware of the number one factor that can void your current 0 easy road annual percentage rate as well as throw you out into the very poor house rapid.
Very great post. I simply stumbled upon your blog and wanted to say that
I’ve really loved surfing around your weblog posts.
In any case I’ll be subscribing on your feed and I’m hoping you write
again soon!
Pretty component of content. I simply stumbled upon your weblog and in accession capital to say that I acquire
in fact loved account your blog posts. Any way I will be subscribing for
your augment and even I achievement you get admission to consistently quickly.
It’s perfect time to make a few plans for the future
and it’s time to be happy. I’ve learn this post and if I may I
want to recommend you some fascinating issues or advice.
Perhaps you could write subsequent articles referring to this article.
I want to read even more issues approximately it!